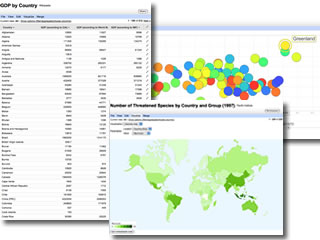
Task: Create data visualizations
- Create two different data visualizations using tools from two of the three categories, e.g. a graph and a word cloud.
- Add the visualizations to your Google site and note which tools you used.

| If you get stuck on any task, please post your questions to the Discussion Forum. |
Last modified: Tuesday, June 19, 2012, 1:51 PM