Charts in a Spreadsheet
When you have different types of data, you may want to use a chart from a spreadsheet program to organize that data. There are 4 main types of charts that are useful for displaying data.
- Bar chart - A bar chart or bar graph is a chart with rectangular bars with lengths proportional to the values that they represent. (Source: Wikipedia)
- Column chart - same as a bar chart, except in columns instead of rows
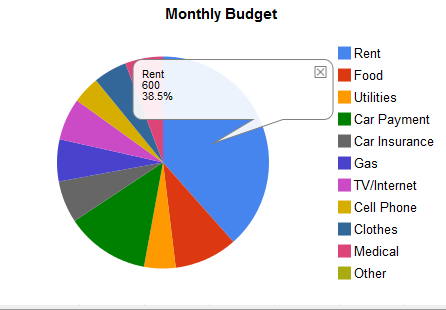
- Pie chart - A pie chart (or a circle graph) is a circular chart divided into sectors, illustrating proportion. In a pie chart, each piece of the pie is proportional to the quantity it represents. (Source: Wikipedia) These charts can be helpful for visualizing percentages.
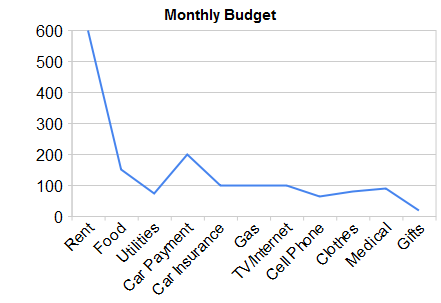
- Line chart - A line chart or line graph is a type of graph, which displays information as a series of data points connected by straight line segments. (Source: Wikipedia)

Last modified: Thursday, July 22, 2010, 9:56 AM


